Abstract
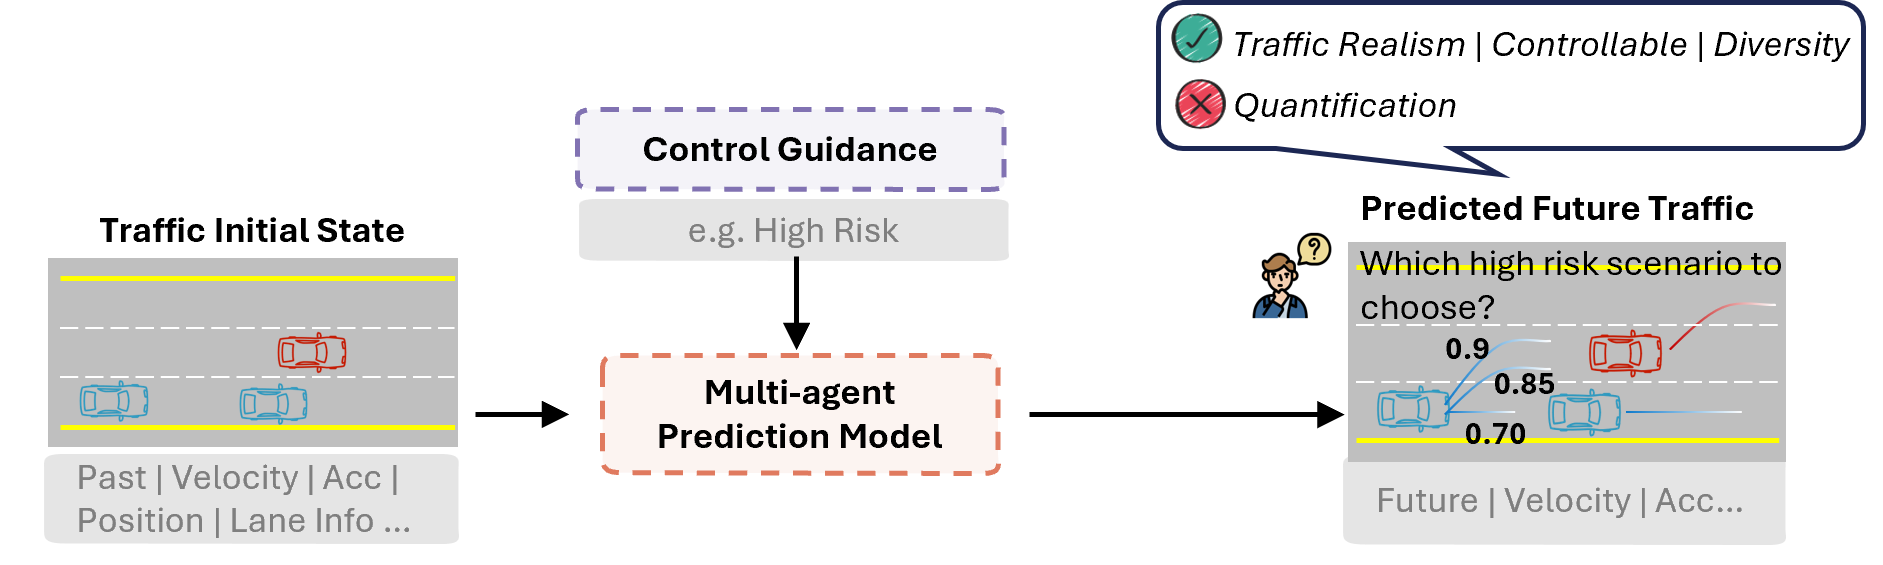
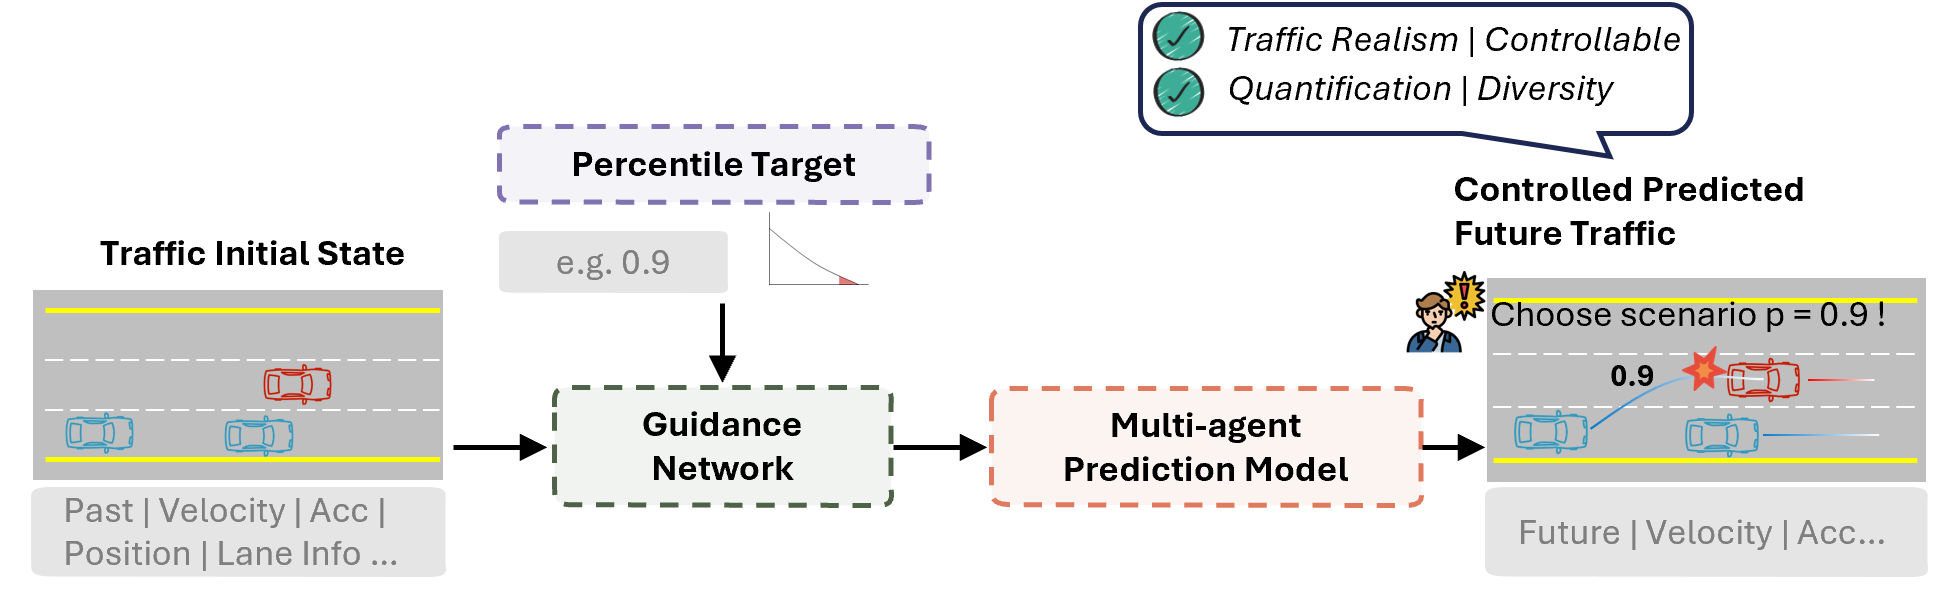
Generating corner-case scenarios with appropriate adversity in a simulation environment is critical for testing an autonomous vehicle (AV) software stack’s safety performance before deployment. Existing autonomous-driving scenario generators can enforce specific behavior, adversity, or feasibility conditions, but they provide limited control over how extreme a generated scenario is relative to plausible futures in the same traffic context. This study represents the adversity of a generated scenario as its percentile in the conditional distribution of future risk given the observed history. This view supports calibrated answers to two questions: how “corner” a generated corner-case scenario is and how its “cornerness” can be fine-tuned.
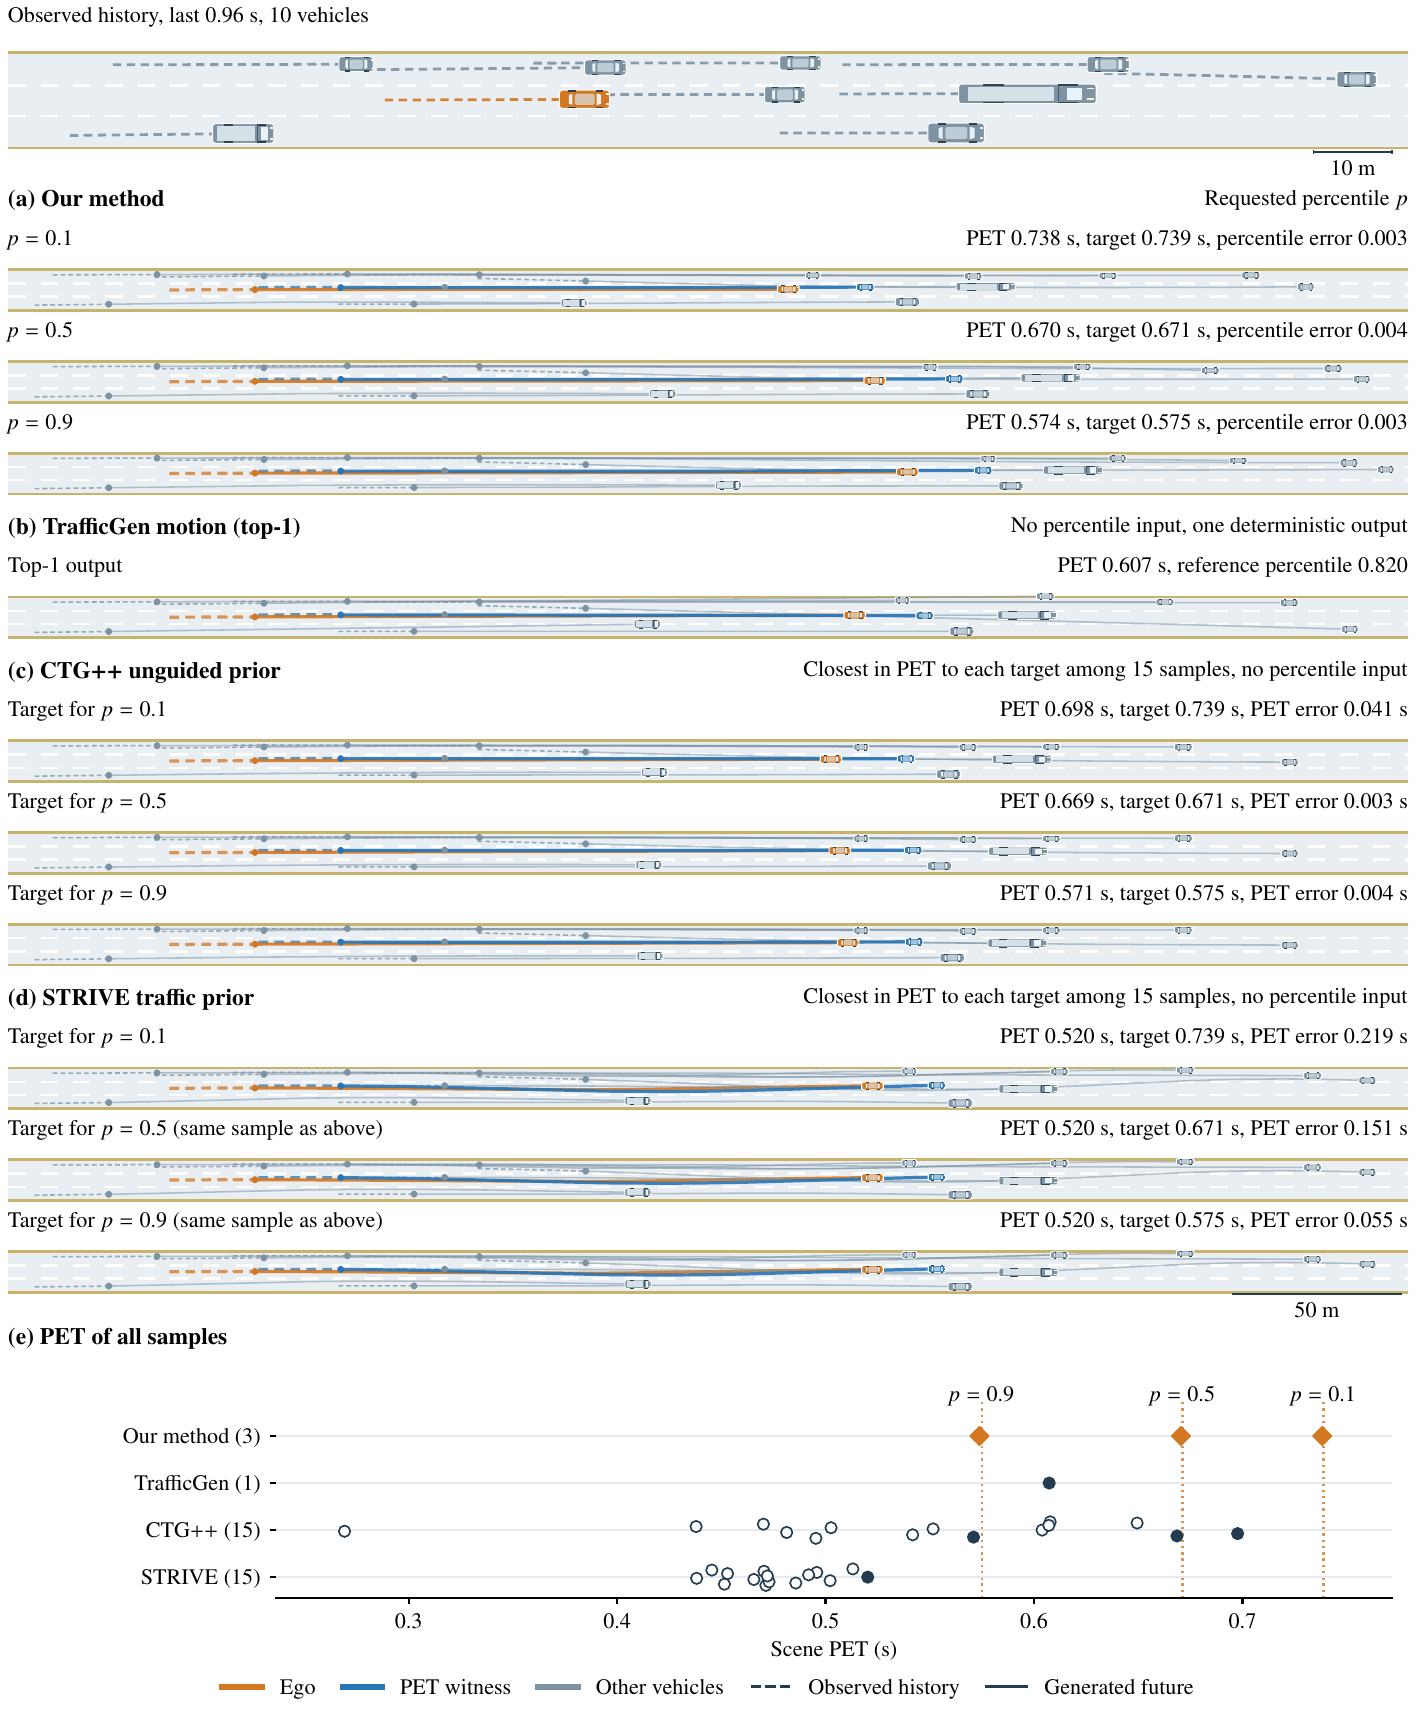
To this end, we formulate history-conditioned risk-percentile requests and learn a reference risk distribution that maps each requested percentile to a physical risk target. We then use a percentile-conditioned joint diffusion model with sampling-time risk guidance to generate multi-agent futures, together with a reference-based criterion for evaluating percentile realization.
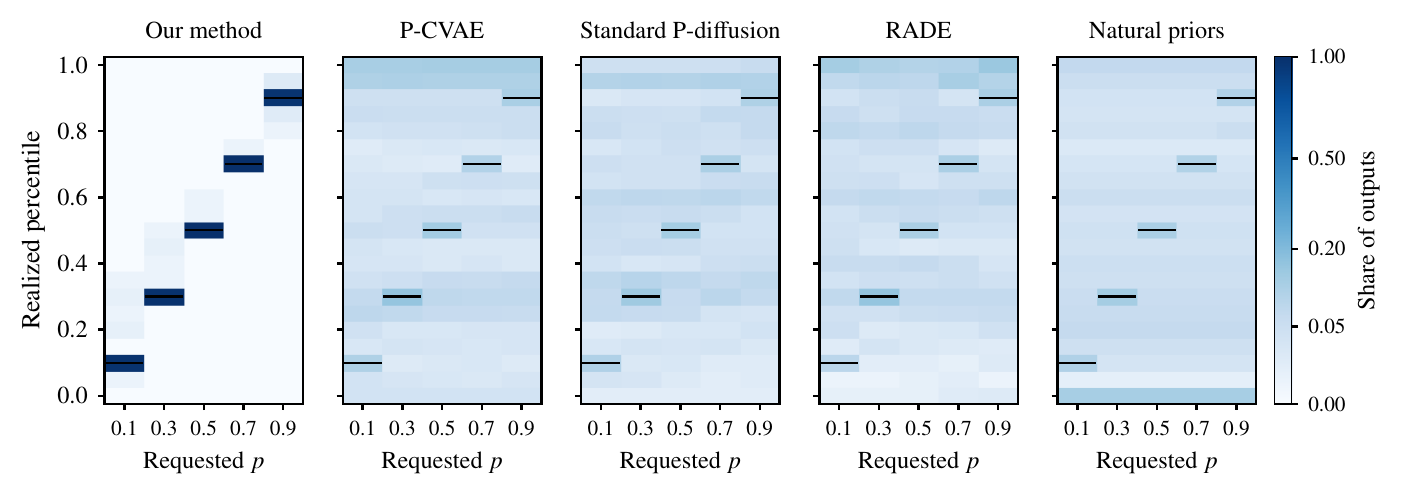
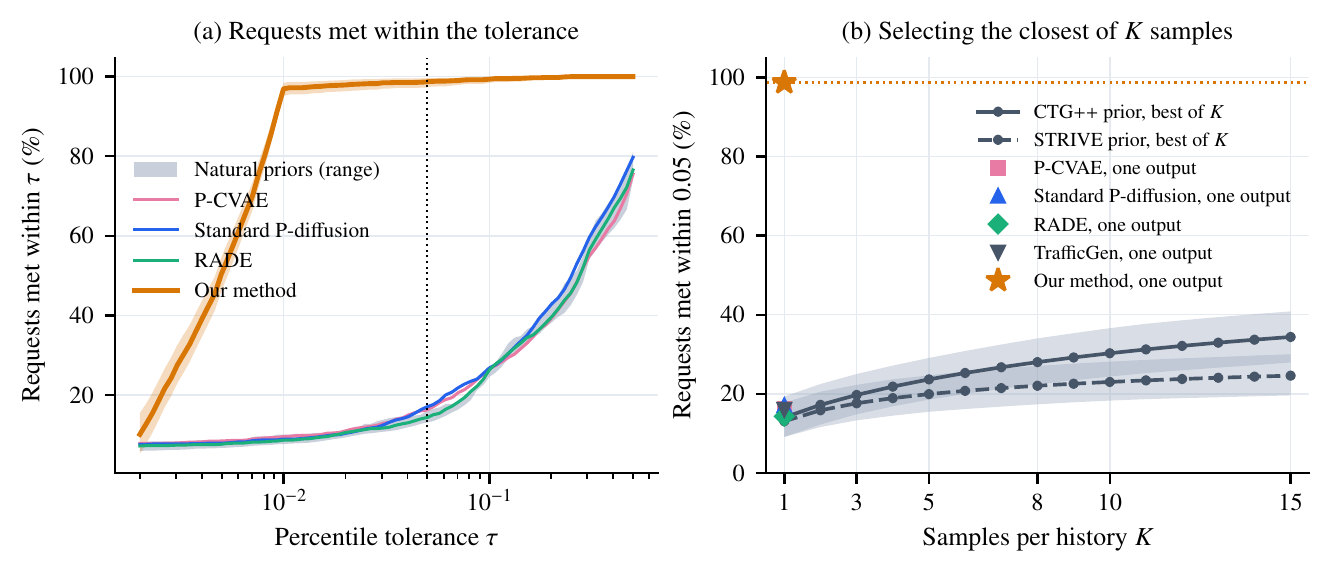
Experiments use the minimum post-encroachment time (PET) between the ego and its surrounding vehicles as the risk surrogate on highD. On the primary evaluation set, our method realizes 1,422 of 1,440 requests within a 0.05 percentile tolerance (98.75%), with mean percentile error 0.00673 and PET-target error 0.00991 seconds. The resulting interface connects context-relative risk specification, physical realization, and evaluation through a common risk scale.
Method
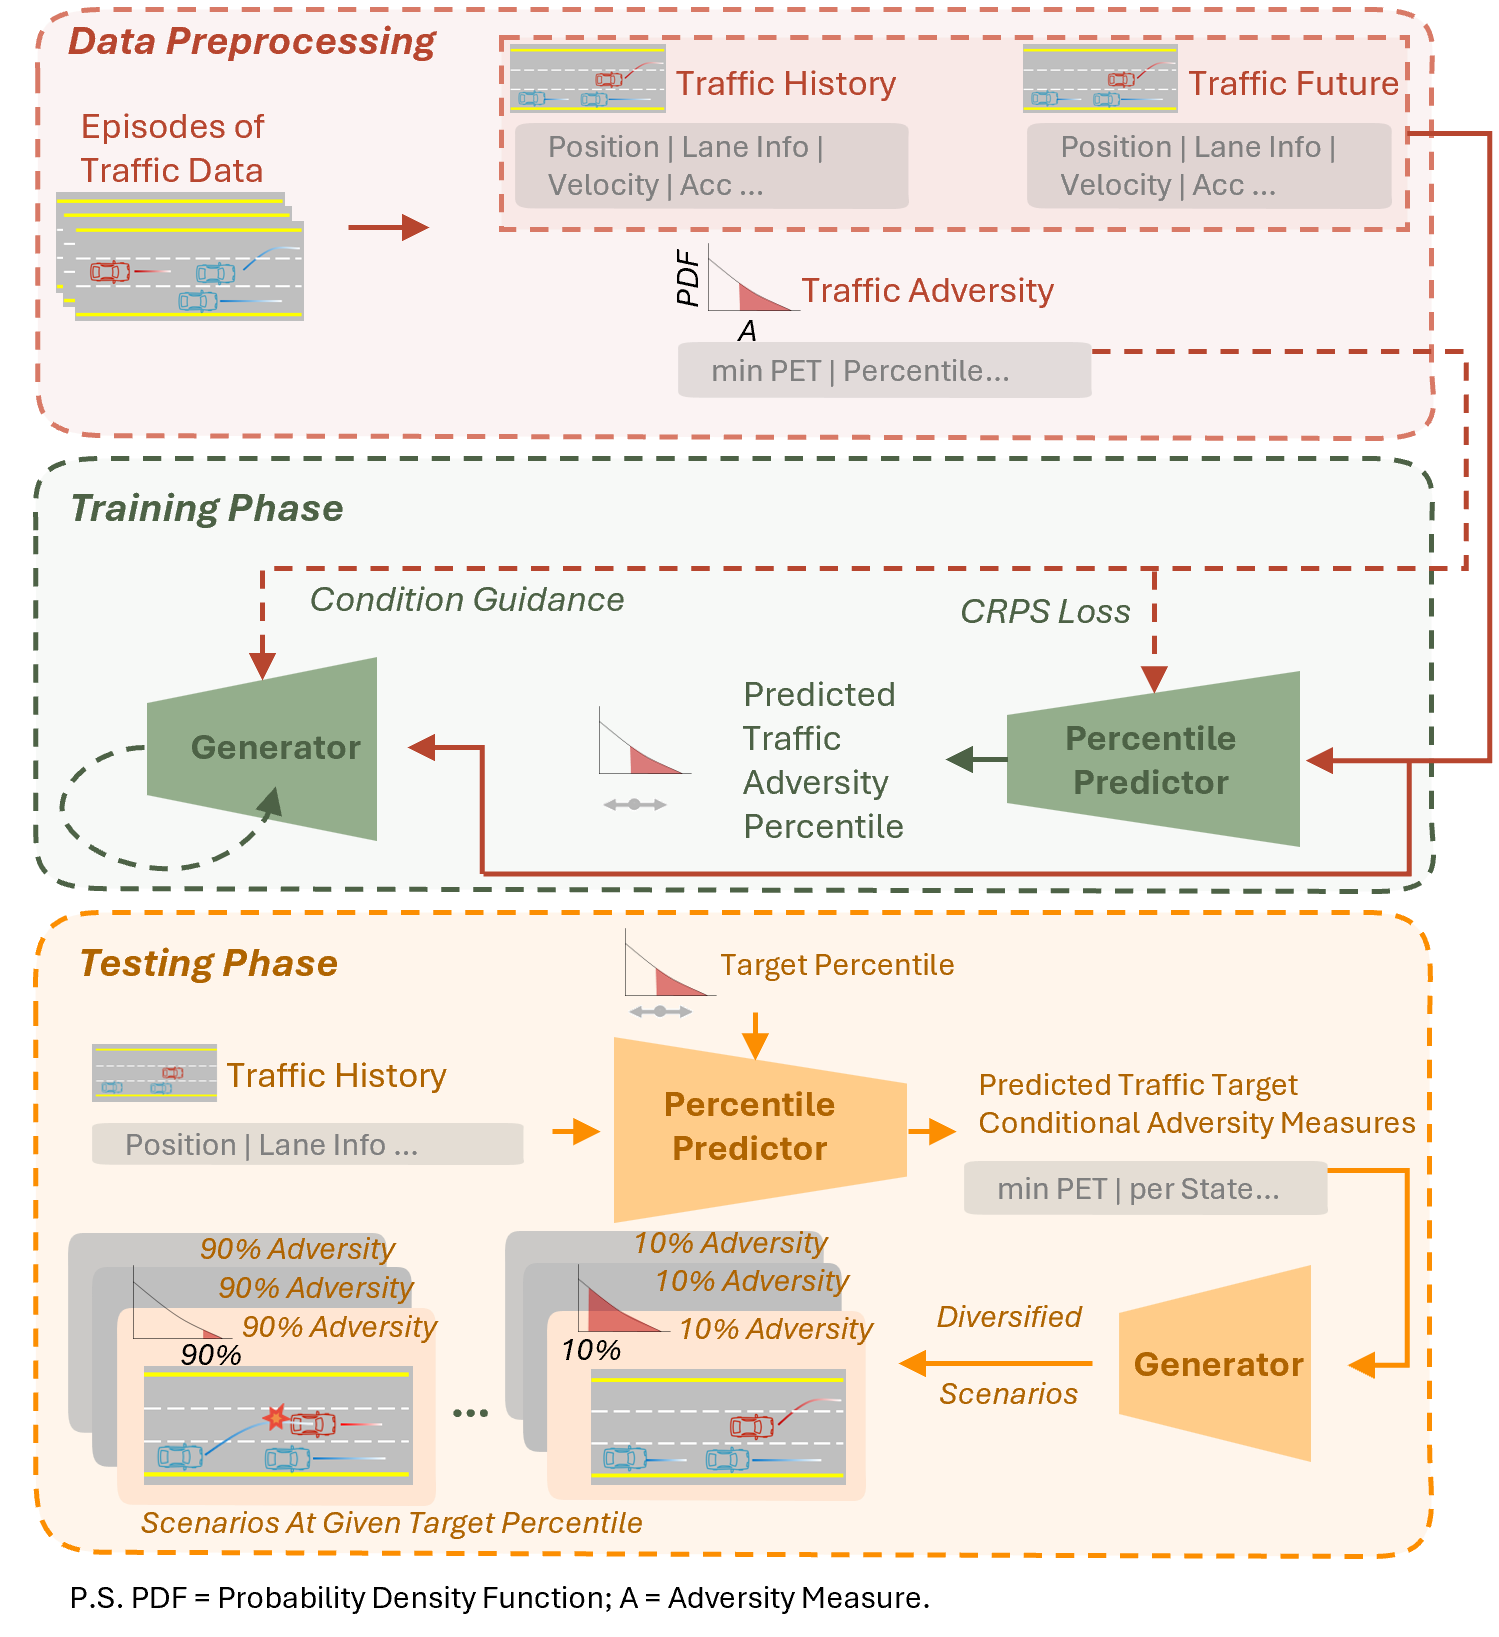
Three-layer workflow: data preprocessing, training and testing. The percentile predictor denotes the reference risk distribution, trained by CRPS on observed scene-risk measurements. The request enters the joint generator directly and guides its sampling path, together with road and background-separation constraints.
- Reference. A risk distribution learned from natural highD trajectories maps each requested percentile p to a physical PET target for the observed history.
- Generation. A percentile-conditioned joint diffusion model generates the futures of all vehicles, and sampling-time risk guidance moves the outcome toward the target while road and background-separation constraints keep the scene feasible.
- Evaluation. A reference-based criterion checks whether the generated future lands at p, including outcomes at probability masses such as the PET cap.
The reference and the generator are one implementation of the request. Any calibrated conditional distribution can serve as the reference, and any generator that can be steered toward a physical target can realize the request.